
We have some upcoming articles where a basic knowledge of how tires work will be needed so we've put together a brief overview. Tire science is incredibly complex, but there are certain aspects that can be quite important for a racing driver to understand. In this article, we will go over load sensitivity, slip angle and induced drag, as well as slip ratio.
Load Sensitivity
In classical static and sliding friction theory, force produced is directly proportional to load. Tires don’t follow this rule however and the amount of friction they generate is not linear.
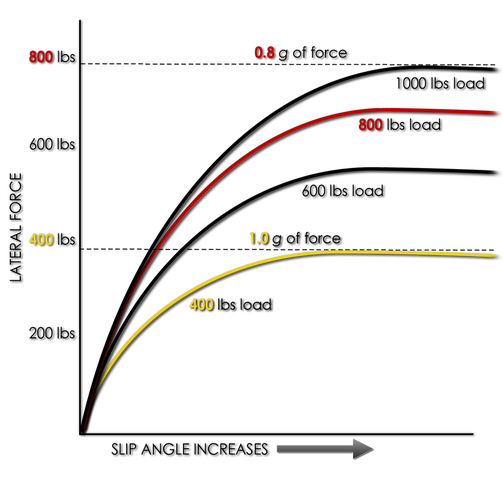
For example, as shown in this diagram if you had a racecar that pressed a tire into the track with 400 lbs of load and this tire could then produce a maximum force of 400 lbs, the tire is said to be capable of 1.0 g of force. If you pressed down on the same tire with 800 lbs however, it wouldn’t produce 800 lbs of force as classical friction theory might suggest. It might take 1000 lbs of load to produce that 800 lbs of force. So on a heavier car, the same tire would only be capable of generating 0.8 g of force. This is because tire grip is load sensitive. Some tires will be more or less sensitive than others, but they will all exhibit some drop-off in grip with increased load.
Load sensitivity is the reason that almost as a rule a racecar should be as light as possible. Not only will it accelerate faster, but it will corner faster as well. Load sensitivity is also the reason that suspension adjustments affect balance. To help you understand why, imagine a car in a corner using tires from the above diagram where the front tires were evenly loaded with 400 lbs each. The car could corner at 1.0 g. Now imagine if we changed the setup so that there were 100 percent load transfer across the front and the outside tire now carried all 800 lbs and the inside tire had no load. The car could now only corner at approximately 0.85 g. Looking at the tire chart, you can see how the red 800 lbs load line is about one quarter of the way between the 0.8 g and 1.0 g force lines. This is quite an extreme example, but this is the reason stiffening the front anti-roll bar on a car increases understeer. More load is transferred across the front tires during cornering and this reduces the net grip at the front of the car. If tires were not load sensitive, changing suspension settings would have no effect on a car's balance. We'll go over load transfer much more in depth in a future article, but now let's move on to the other element from the diagram we haven't covered yet.
Slip Angle
| A tire may seem quite rigid, but just watch this video of a tire on a testing machine and you will see how much distortion and twisting the tire carcass can experience. Even at parking lot speeds there will be some tire flexing and in race conditions the amount of flex can be significant. This causes the direction the wheel is facing to not quite be the same as the direction it is traveling. The difference between these directions is called the slip angle. | |
In the above load sensitivity diagram, you'll notice how the force builds as slip angle increases. The forces build up quickly in a fairly linear fashion and then begin to taper off at maximum force and then slowly start to go back down. What is happening is that as you approach the peak of grip, the outer portion of the contact patch begins to slide and this sliding portion grows toward the center of the contact patch until the entire tire is sliding. Somewhere between the contact patch starting to slide and completely sliding is where you will find your maximum force.
The diagram also shows that a higher load generates maximum grip at a higher slip angle. The harder a tire is pressed downward, the more it will distort before it reaches its maximum grip. Imagine if you turned an unmounted tire with your hand that is just sitting on the ground. It would be seeing very little load so would therefore be able to produce very little force. It would have almost no visible distortion as it was turned. The peak grip would be achieved at less than 1 degree of slip angle. Most tires produce maximum grip with a slip angle of somewhere between 4 to 10 degrees. Stiffer low-profile race tires will peak at lower slip angles because they distort less before reaching maximum grip.
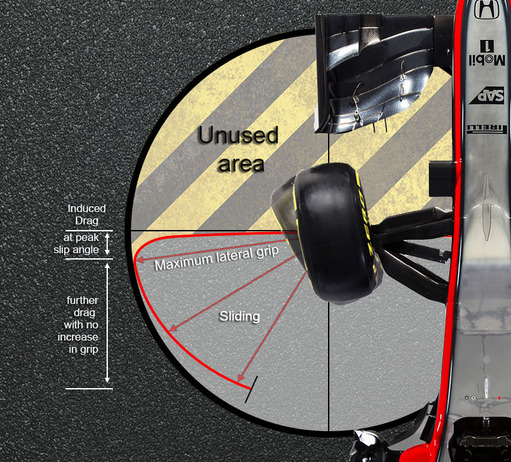
Just search for slip angle graph in Google and you will find many examples of "artist rendition" graphs depicting how tire grip falls off significantly past the peak of grip. In reality, the loss in traction is typically fairly minimal unless the road is wet. You might see a bigger drop-off in damp conditions as hydroplaning is more likely to result. While it often feels that grip drops off significantly, if we take the data from a graph and lay it down on a traction circle around a tire, it will be easier to visualize what is happening.
If you have a car going at a constant speed and the driver then steadily increased the steering, the force line would start at the center of the tire and move quickly outward, but angled slightly toward the rear of the car until it reached the outside of the circle at the limit of traction. We’ve shown three arrows representing tire forces at the peak of grip and then while sliding, but at any instant, the arrow would simply follow the curved line as the tire turned more in relation to the track and increased its slip angle. Remember, those arrows are showing the actual direction the tire is trying to push the car.
The diagram also shows that a higher load generates maximum grip at a higher slip angle. The harder a tire is pressed downward, the more it will distort before it reaches its maximum grip. Imagine if you turned an unmounted tire with your hand that is just sitting on the ground. It would be seeing very little load so would therefore be able to produce very little force. It would have almost no visible distortion as it was turned. The peak grip would be achieved at less than 1 degree of slip angle. Most tires produce maximum grip with a slip angle of somewhere between 4 to 10 degrees. Stiffer low-profile race tires will peak at lower slip angles because they distort less before reaching maximum grip.
Just search for slip angle graph in Google and you will find many examples of "artist rendition" graphs depicting how tire grip falls off significantly past the peak of grip. In reality, the loss in traction is typically fairly minimal unless the road is wet. You might see a bigger drop-off in damp conditions as hydroplaning is more likely to result. While it often feels that grip drops off significantly, if we take the data from a graph and lay it down on a traction circle around a tire, it will be easier to visualize what is happening.
If you have a car going at a constant speed and the driver then steadily increased the steering, the force line would start at the center of the tire and move quickly outward, but angled slightly toward the rear of the car until it reached the outside of the circle at the limit of traction. We’ve shown three arrows representing tire forces at the peak of grip and then while sliding, but at any instant, the arrow would simply follow the curved line as the tire turned more in relation to the track and increased its slip angle. Remember, those arrows are showing the actual direction the tire is trying to push the car.
Induced Drag
The exact shape of the curve would depend on the tire construction, but the illustration shows what a typical race tire might do. Ideally, we would want the arrow to go straight out to the side, just giving us pure lateral force as we turned the steering wheel, but even with no brakes applied, our tire force line will always have some deceleration force as well. The rearward movement of the force line is called induced drag and this is very important to take into account. At the point of peak lateral grip where the arrow is as far laterally as it’s going to get, there is already a fair amount of drag. This is caused by partial sliding of the contact patch and the twisting of the tire carcass under load. In general, the stiffer the tire is, the less induced drag there will be. The part labeled unused area shows how the tire will never generate force in that area. The line would never go completely sideways because of induced drag or forward because this is not a 4-wheel drive car.
As you can see, if the driver continued to turn the wheel past the peak of grip, the force line would pull in from the edge of the circle and follow it around toward the rear of the car until you hit the maximum steering lock. It doesn’t stay on the outside of the circle because you are past the grip peak at this point and the tire is completely sliding. The actual grip the tire is producing is still fairly high as the line is still near the edge of the circle, but the lateral force is significantly reduced as the tire starts to act as if you are applying the brakes. The car will have significant understeer as the tire is now trying to push the car backwards from its current direction of travel. An important takeaway here is that anytime a tire generates lateral grip, even a tiny amount, there will always be at least some rearward drag force that acts just like using brakes. The amount of this will vary based on the tire, but the drag forces a tire generates at its peak of grip are not insignificant and adding to this induced drag by steering more than necessary can be very harmful to lap times.
As you can see, if the driver continued to turn the wheel past the peak of grip, the force line would pull in from the edge of the circle and follow it around toward the rear of the car until you hit the maximum steering lock. It doesn’t stay on the outside of the circle because you are past the grip peak at this point and the tire is completely sliding. The actual grip the tire is producing is still fairly high as the line is still near the edge of the circle, but the lateral force is significantly reduced as the tire starts to act as if you are applying the brakes. The car will have significant understeer as the tire is now trying to push the car backwards from its current direction of travel. An important takeaway here is that anytime a tire generates lateral grip, even a tiny amount, there will always be at least some rearward drag force that acts just like using brakes. The amount of this will vary based on the tire, but the drag forces a tire generates at its peak of grip are not insignificant and adding to this induced drag by steering more than necessary can be very harmful to lap times.
Slip Ratio
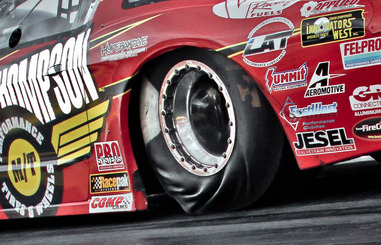
Before we close down this article, we should also mention the similar phenomenon called slip ratio. This deals with tire forces acting during acceleration and braking. Instead of an angle, slip ratio is the difference between the speed the wheel is rotating vs the speed that it is traveling. As an example, during maximum braking with a slip ratio of 15%, if a car were traveling at 100 mph, the wheel is actually only spinning at the equivalent of 85 mph. This might be a little harder to visualize than slip angle, but watching a drag tire distort as it launches provides a nice example of a very high slip ratio. You should also realize that tire slip angle and slip ratio work in combination. Try to imagine how a front outside tire might distort while trail braking into a turn as it sees both braking and turning forces.
I hope you enjoyed this article. If you are interested in a complete guide to the physics of racing, we also offer The Science of Speed book series, available through our bookstore or at popular retailers such as Amazon.
by Adam Brouillard
I hope you enjoyed this article. If you are interested in a complete guide to the physics of racing, we also offer The Science of Speed book series, available through our bookstore or at popular retailers such as Amazon.
by Adam Brouillard