
| For part 2 in this Racing Line Fundamentals series, we’re going to explore the factors that determine the ideal apex and line through a corner. We’ll learn how a vehicle’s ratio of acceleration compared to its cornering ability governs the ideal apex a driver needs as well as how this influences the line the vehicle will take through a corner. |  1. The Acceleration Point 2. The Ideal Apex 3. The Chicane 4. The Double Apex 5. The Straightaway 6. The 90-Degree Limit |
The Apex Defined – Early Apex vs Late Apex
We learned in part 1 how the ideal acceleration point is at the apex of the corner, but now we need to determine the location of the apex as well as the angle and speed the vehicle will have as the driver reaches it. This is not as complicated as it sounds however, as all these factors are linked. A good way to visualize this relationship is to overlay circles on an overhead view of a corner representing different corner entry paths. You can see in the illustration below how we have laid two circles of differing size over the entry to a corner. Both circles are placed so that they are aligned with the corner entry edge where the turn-in points are marked and then shifted left or right until the circles just touch the inside of the track near the apex area. The car in the illustration is currently driving at the limit on the smaller red circle, and this circular path means the car will be at a constant speed from turn-in to the apex, which is marked by a yellow dot. A circular entry is not the fastest corner entry method, but using circles makes visualizing the relationship between apex angle and speed easier and the principles we’ll learn here are the same as with a more ideal corner entry method which we’ll look at near the end of the lesson.
We learned in part 1 how the ideal acceleration point is at the apex of the corner, but now we need to determine the location of the apex as well as the angle and speed the vehicle will have as the driver reaches it. This is not as complicated as it sounds however, as all these factors are linked. A good way to visualize this relationship is to overlay circles on an overhead view of a corner representing different corner entry paths. You can see in the illustration below how we have laid two circles of differing size over the entry to a corner. Both circles are placed so that they are aligned with the corner entry edge where the turn-in points are marked and then shifted left or right until the circles just touch the inside of the track near the apex area. The car in the illustration is currently driving at the limit on the smaller red circle, and this circular path means the car will be at a constant speed from turn-in to the apex, which is marked by a yellow dot. A circular entry is not the fastest corner entry method, but using circles makes visualizing the relationship between apex angle and speed easier and the principles we’ll learn here are the same as with a more ideal corner entry method which we’ll look at near the end of the lesson.

Instead of turning in at the red circle, we can also see how the driver could have turned in earlier at the blue circle. The blue circle is larger so this means the car would be traveling faster as it turned in and would also have this same higher speed as it reaches the apex. The apex would also meet the inside of the track earlier in the corner and at a lower angle. This relationship between apex angle, speed, and position is consistent. If the driver traveled on a circle that was in between the size of the blue and red circles, the apex angle, speed, and position would all be in between as well. This relationship also shows us the key tradeoff between apex angle and speed. For a given vehicle, a lower apex angle (earlier apex) will have a higher possible apex speed, and a higher apex angle (later apex) will have a lower possible apex speed. We primarily use angle rather than position to define the apex because while the angle will always change as the apex progresses from earlier to later, the position may not. For example, if the inside of the track has a smaller profile, as in the following illustration where the apex is a cone, the position of the apex stays virtually the same as the apex angle and its associated speed changes. The larger and more rounded the inside of the corner is, the more the position of the apex will shift as it progresses from earlier to later.

So we’ve learned that as we move from an earlier to a later apex, we gain angle, but lose speed. The ideal tradeoff between these two factors will depend on each vehicle’s capabilities and a simple, but reasonably effective method to start finding it is to determine the apex where going to full throttle allows the car to barely stay on track at corner exit. If full throttle from the apex causes the driver to start running wide, they need a later, slower apex. If on the other hand, full throttle doesn’t force the car to the track edge, they should use an earlier, faster apex. This is called the Full Throttle Exit Shortcut and is a good method for beginning drivers in lower power cars to quickly start finding some speed. This does have its limits of course, as it doesn’t work well in wheelspin-limited situations or in more advanced corner types that shouldn’t be optimized to the track edge. Beyond this, it also doesn’t offer the precision feedback a driver needs to find that last bit of time. For example, an unknowing driver might apex early and then use slightly too much steering input, which increases induced drag and therefore reduces acceleration, but still think they optimized the corner because they were pushed right to the track edge. To progress further in their development and find a complete solution, a driver can then look to the underlying physics that govern the ideal line to guide them.
The Physics of the Racing Line
Although a typical racetrack looks like a complex series of various curves, it can primarily be broken down into linear zones of acceleration and deceleration separated by apexes. A double apex is the one exception, as it acts essentially as an extended apex, and as we progress through the lesson series, we’ll see how all of these corner types fit together. To start however, let’s zoom in one of these linear acceleration zones so we can begin learning how a correct apex is key to an optimized corner exit.
Although a typical racetrack looks like a complex series of various curves, it can primarily be broken down into linear zones of acceleration and deceleration separated by apexes. A double apex is the one exception, as it acts essentially as an extended apex, and as we progress through the lesson series, we’ll see how all of these corner types fit together. To start however, let’s zoom in one of these linear acceleration zones so we can begin learning how a correct apex is key to an optimized corner exit.

To introduce this subject, we will first be using a car with a power level that exactly matches the drag forces during a full throttle corner exit and so will maintain a constant speed throughout its exit. The driver of the car in this image goes to full throttle at the apex of the corner and then drives at the car’s 1.2 g traction limit on a circular 50 mph arc out to the track edge. This is the ideal apex and exit for the car and we can see how it follows the full throttle exit shortcut. An earlier, faster apex would cause the car to start running wide, and a later, slower apex would cause the car to not need the entire track width during corner exit.
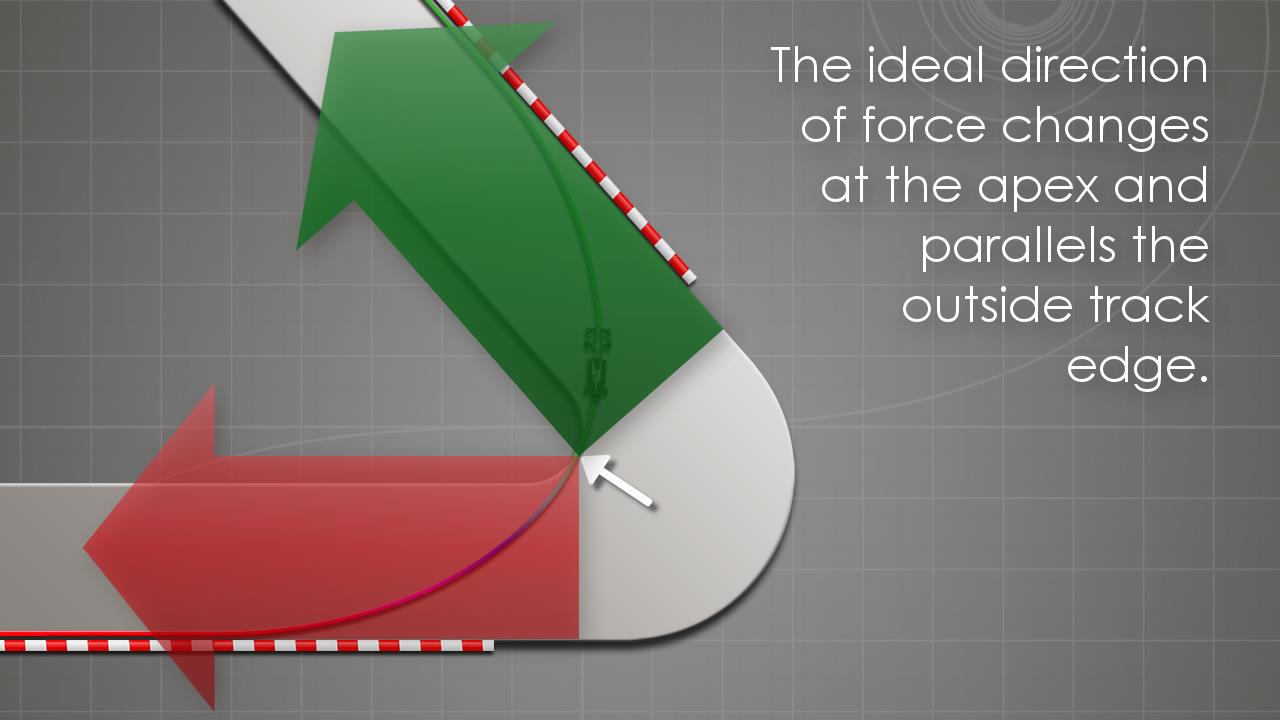
Now let’s examine what is happening from a physics perspective so we can understand exactly why this apex and exit is ideal for the car. Although the driver takes a circular path out to the track edge, this is actually done to optimize linear acceleration and from the moment they pass the apex, the driver’s goal is to maximize the force achieved accelerating the car in the same direction as the following straightaway. This is called the ideal direction of force and in a standard corner such as this, the ideal direction simply parallels the track. In later lessons we’ll learn how the ideal direction is determined in other corner types as well. A good way to understand this principle is to visualize that corner exit is essentially a drag race that begins at the apex with the car starting at some angle from the finish. The ideal apex and exit is the one that allows the car to complete this drag race in the minimum possible time.

You can see in the image how we have added a finish line representing the ideal direction and the driver’s goal is to maximize the vehicle’s acceleration toward it from the instant they cross the apex. As it would not affect the ideal apex and line, it doesn't matter how far along the straightaway we visualize the finish to be. In this case, the ideal apex is exactly 90 degrees from the finish with an associated apex speed of 50 mph. This relationship between a vehicle’s current speed and its angle relative to the track is important to understand because, while the car does have a velocity of 50 mph as it passes the apex, this velocity would currently be directly toward the track edge and so this is called its cross-track velocity. The car’s velocity in the ideal direction toward the finish however, called in-track velocity, would be 0 mph. In other words, at the apex, the car has no movement relative to the finish line in the same way a car about to start a normal drag race wouldn’t have any. As the car then progresses through corner exit, its in-track velocity would increase from 0 to 50 mph while its cross-track velocity would drop from 50 to 0 mph.
The reason we separate velocity into these two directions is that, from a lap time perspective, only the vehicle’s movement in the ideal directions matter. How quickly the car is moving across the track doesn’t directly affect its times in the same way that it doesn’t on a dragstrip. If we could suddenly increase the car's apex speed and therefore cross-track velocity to 100 mph, this would not be helpful, as it would simply send it off track. Even one additional mph would reduce the car’s acceleration toward the finish because this is already the car’s ideal apex. 100% of the tire force is already being used to keep the car on its current circular path, so more cross-track velocity would cause the driver to need to reduce throttle and slow down so they don’t run wide. Additional apex speed would only be useful if the car also had more apex angle, but as we’ve learned, this is the opposite of the tradeoff that happens at the apex. Achieving the proper amount of cross-track velocity is still very important however, so let’s look now at how this assists in generating in-track velocity.
Corner Exit Physics
Since the car maintains its speed of 50 mph throughout corner exit, it might be tempting to say that it has conserved momentum, but momentum is not actually being conserved here. Instead, momentum is being converted into acceleration, which then becomes new momentum. At the apex, the car is experiencing 1.2 g of lateral acceleration from the tires’ maximum ability to overcome the vehicle’s forward momentum and turn, and it’s important to understand that this lateral acceleration is the same as forward acceleration. The sideways force that a driver feels on their body while cornering is the same as the force they feel on their back while accelerating. If there were a nearby car that just launched toward the finish at 1.2 g using a standard drag race start, they would both currently be experiencing 1.2 g of in-track acceleration and starting to move toward the finish at the exact same rate.
Since the car maintains its speed of 50 mph throughout corner exit, it might be tempting to say that it has conserved momentum, but momentum is not actually being conserved here. Instead, momentum is being converted into acceleration, which then becomes new momentum. At the apex, the car is experiencing 1.2 g of lateral acceleration from the tires’ maximum ability to overcome the vehicle’s forward momentum and turn, and it’s important to understand that this lateral acceleration is the same as forward acceleration. The sideways force that a driver feels on their body while cornering is the same as the force they feel on their back while accelerating. If there were a nearby car that just launched toward the finish at 1.2 g using a standard drag race start, they would both currently be experiencing 1.2 g of in-track acceleration and starting to move toward the finish at the exact same rate.

As our car then progresses through corner exit, its lateral acceleration would stay at a constant 1.2 g, but this can be divided into in-track acceleration (green), which would begin to steadily decrease from 1.2 g, and cross-track deceleration (red), which would begin to increase. At the halfway point, we can see that the 1.2 g lateral force is still aimed directly at the turn center, but we can split this vector force into its two components. In-track acceleration has dropped to .85 g so the car is still increasing its velocity toward the finish, but at a lower rate than it had at the apex. Cross-track deceleration has likewise increased from 0.0 g to .85 g reducing the car's velocity toward the track edge. This steady tradeoff happens throughout the exit until, at the very end, acceleration toward the finish tapers off to 0.0 g as the full 1.2 g of tire force is now being used to finally bring the car’s cross-track velocity to 0 mph so it doesn’t run wide.
In this first example, we used a car that would have an ideal apex of exactly 90-degrees from the finish so that it would start with an in-track velocity of 0 mph and make this principle easier to understand, but all corners will have this same goal of trying to maximize acceleration in the ideal direction. If the ideal apex for a vehicle has an exit under 90 degrees and it's angled more toward the finish, then it will simply begin corner exit with some in-track velocity already. In high-speed corners with a very low angle change, a car can have a great deal of in-track velocity as corner exit begins. In high angle corners however, an ideal apex won’t ever be more than 90 degrees from the exit, as this would cause the car to have negative in-track velocity as corner exit begins. We’ll learn more about this 90-degree limit in a future lesson.
While it seems that a lot of tire force is being used to simply reduce cross-track velocity in the corner, this isn’t wasted force because this velocity is what allowed the car to generate its acceleration in the ideal direction. There is nothing forcing the driver to make their line use the entire track width. They could have driven a tight arc around the inside of the track, but this would give them less cross-track velocity that can then be converted into acceleration. Understanding how different vehicles need different cross-track velocities at the apex to help maximize their acceleration is important because this is what determines each car’s ideal apex. In the case of our current example car, this is easy to visualize because it has no ability to gain speed during corner exit and so the ideal apex is simply the one that creates a perfect circle out to the track edge. Most vehicles are able to gain speed during corner exit however, so let’s now move on to our next example car that has the same 1.2 g of grip, but more power.
Comparing High Vs Low Acceleration Vehicle Racing Lines
An important principle to understand is that the more acceleration potential a vehicle has in relation to its cornering ability, the later the apex it will need. For example, if our new more powerful car used the same apex that was ideal for our original car, it would be no faster through the corner because it would have no ability to use that additional power until the corner was over. 100% of the tire grip is already being used to keep the car on a constant speed arc and trying to use any additional power would cause it to start running wide. Our more powerful car will need a later apex so it will have room for its line radius to expand as it accelerates during corner exit. To understand how a vehicle’s acceleration vs cornering potential affects the shape of its exit line, we can examine its G-G plot.
An important principle to understand is that the more acceleration potential a vehicle has in relation to its cornering ability, the later the apex it will need. For example, if our new more powerful car used the same apex that was ideal for our original car, it would be no faster through the corner because it would have no ability to use that additional power until the corner was over. 100% of the tire grip is already being used to keep the car on a constant speed arc and trying to use any additional power would cause it to start running wide. Our more powerful car will need a later apex so it will have room for its line radius to expand as it accelerates during corner exit. To understand how a vehicle’s acceleration vs cornering potential affects the shape of its exit line, we can examine its G-G plot.
A G-G plot is a telemetry readout that shows the longitudinal and lateral forces acting on a vehicle and the maximum readings show the force the vehicle can achieve at the limit. In comparison to a tire friction circle, which is round because a tire can achieve approximately the same force in any direction, a G-G plot will have a unique shape based on a vehicle’s capabilities. If a car is setup and driven well, the bottom half of the G-G plot is usually round because most cars have powerful four-wheel brakes and so the driver is able to optimize their tires’ potential throughout corner entry. All four tires can be at the limit during straight line braking, or during pure cornering, or during a combination of braking and turning at the same time. During corner exit however, this is no longer the case and so the top of the G-G plot is usually not round. Many cars simply don’t have the power to bring the tires to the limit during forward acceleration, especially in higher speed corners. Even with sufficient power to bring the tires to the limit however, most performance cars are only driving the rear wheels. The front tires can be at the limit as well, but they are only producing lateral force. Only a four-wheel drive vehicle with enough power to keep all four tires at the limit throughout the entire exit can produce a G-G plot with a round top half.

Most cars will produce a G-G plot like this one, which looks like a circle with part of the top sliced off. The lower a vehicle’s ratio of acceleration to cornering potential, the more of the top will be missing. The G-G plot for our first example car would actually be one with the top half of the circle completely absent, as it had no ability to accelerate at all during the corner. For our new more powerful example car however, we’ll go to the other end of the spectrum and look at a car with a completely circular G-G plot.
G-G Plot Shapes

Before we put our new car on track however, let’s first talk about how the driver influences where on the circle they are. This will all be assuming we have a top-level driver who is able to keep the car at the very edge of the circle producing maximum force at all times when they need to. This is, of course, easier said than done and developing this ability is a large part of a driver’s training.
| Before the actual corner begins during the straight-line braking portion, the driver would be at the bottom center of the circle, as they would be decelerating the car directly backwards. Then at turn in, as steering began to progressively increase while braking progressively decreased, the combined tire forces would steadily move around the edge of the circle like the hand of a clock with the exact combination of steered angle and braking force at any moment dictating how far around the circle the driver currently was. For corners where deceleration isn’t needed until after turn-in, the driver would maintain throttle as steering would still begin to progressively increase at turn-in to follow the same ideal line to the apex, but the driver would then move directly to the appropriate place on the circle at the point deceleration is needed and continue around the outside of the circle from there. |  |
As the car passes the apex, the driver would then move to the top half of the circle where steering would now progressively decrease while throttle increased to continue around to the very top of the circle at the end of the corner. What’s important to understand here is that the driver’s current inputs, and therefore location on the circle, indicates the actual direction on the track that the combined tire forces are currently pushing the car. It can be educational to overlay a single data point from a G-G plot oriented to an overhead view of the car’s corresponding position in a corner to see how the driver’s inputs are currently aiming those forces in relation to the track. Now that we’ve seen how a driver controls where on the circle they are, let’s put our new example car on track to see how the differing shapes of the G-G plots dictate the ideal apex and line needed.

In the image, we can see our original blue car and its circular exit line as well as our new more powerful red car. First looking at the original blue car, we can now understand how the driver would have been directly on the side of the G-G plot throughout the exit, as the car would only be experiencing lateral force. This required they not unwind the steering until just as the corner ends while maintaining full throttle from the apex even though this only gave them just enough power to counteract drag forces. What’s key to understand here is that since the car was unable to move up into the acceleration portion of the G-G plot, it was limited to this circular exit line and this is what determined its ideal apex.
Looking next at our new red car however, with four-wheel drive and large amounts of power, this driver is now able to continue around to the very top of its circular G-G plot. This requires the driver progressively unwind steering while increasing throttle and we can see the significant effects this has on their exit line. As their speed would now progressively increase during exit, their line radius would progressively increase as well, and in order to not run wide, this would require a later apex than the blue car. We can also see why, from a physics perspective, the red car is faster not just down the straightaway, but through the corner itself. By examining the force arrows near the halfway points of each car’s exit we can see that they are both experiencing the same 1.2 g of force because they have the same amount of grip, but the red car’s force arrow has moved farther around to the front of the car and is aimed more toward the finish. Near the apex, both car’s force arrows would be aimed well toward the finish, but only the powerful red car is able to maintain this throughout the exit, while the blue car’s force arrow would stay to its side, angling farther and farther away. It may be tempting to think that the red car would want to try to aim its force arrow directly toward the finish throughout the exit, but even though the red car would have less cross-track velocity being converted into acceleration from its later apex, it would still have some and this velocity must still be brought to zero by the end of the corner or the car will run wide.
So we’ve now looked at the ideal corner exit lines for a vehicle with equal cornering and acceleration ability and a circular G-G plot, as we well as a vehicle with no acceleration ability at all taking away the top half of its G-G plot completely. I often refer to this as the apex spectrum because almost all vehicles will fall somewhere between these two extremes, and therefore their exit lines and ideal apexes will as well. It’s important to understand however, that these are not hard limits. A drag racing car that accelerated better than it cornered would have an oblong G-G plot and would need an even later apex than our red car as its line radius would need to expand even faster. Likewise, in lower-powered racing classes, a car can sometimes even lose speed at full throttle in some high-speed corners and therefore its line radius will actually decrease during corner exit. These are rare occurrences however, and most cars will stay within a fairly small range of lines during corner exit. This range is typically even smaller during corner entry however, so let’s take our knowledge of how a G-G plot determines line shape and revisit that now.
Corner Entry with Optimized Force Direction
When we first looked at corner entry at the beginning of the lesson, we used a circular approach to more easily visualize the tradeoff between apex angle and speed and we’ve now learned this circular line means the driver would have needed to stay on the side of the G-G plot from turn-in to the apex. This entry would be the equivalent of our non-accelerating blue car’s exit line and would only be ideal for a car that had no ability to brake and turn at the same time. Most cars are able to combine braking and turning effectively however, and this ability essentially gives them the corner entry version of our powerful red car’s exit. Just as the red car was able optimize tire force in the ideal direction during corner exit by steadily progressing around to the top of the circle, almost all cars can do the same during corner entry on the bottom of the circle. In a standard corner, the ideal direction of force during corner entry parallels the track in the same way that it does during corner exit and the ideal direction shifts right at the apex. This optimized entry requires the driver progressively decrease brakes while increasing steering to move around from the bottom of the circle to the side and many readers will recognize this as trail braking.
When we first looked at corner entry at the beginning of the lesson, we used a circular approach to more easily visualize the tradeoff between apex angle and speed and we’ve now learned this circular line means the driver would have needed to stay on the side of the G-G plot from turn-in to the apex. This entry would be the equivalent of our non-accelerating blue car’s exit line and would only be ideal for a car that had no ability to brake and turn at the same time. Most cars are able to combine braking and turning effectively however, and this ability essentially gives them the corner entry version of our powerful red car’s exit. Just as the red car was able optimize tire force in the ideal direction during corner exit by steadily progressing around to the top of the circle, almost all cars can do the same during corner entry on the bottom of the circle. In a standard corner, the ideal direction of force during corner entry parallels the track in the same way that it does during corner exit and the ideal direction shifts right at the apex. This optimized entry requires the driver progressively decrease brakes while increasing steering to move around from the bottom of the circle to the side and many readers will recognize this as trail braking.
| So let’s look again at our original corner entry comparison, except instead of using different size circles, we will use different size Euler spirals. An Euler spiral is a line that’s curvature starts to increase linearly along its length and this makes for a good corner entry blueprint because it closely matches what an optimized entry in most cars will be. As the driver progressively increases steering as they move around to the side of the G-G plot, their line radius will steadily decrease and follow this basic shape. When using the Euler spiral to examine possible apexes, it’s important to never use more than, at most, the first 90 degrees, as marked in red. As we discussed earlier with how an exit shouldn’t ever go over 90 degrees, an entry shouldn’t either, and we’ll talk more about the implications of this 90-degree limit in future lessons. |  |
Similarly to how we did earlier with the circles, we will align the beginning straight section of the spiral with the corner entry edge and then shift the spiral left or right until the curved section just touches the apex area. The circles in the image below show the line radius achieved at each apex as we’ve removed the remainder of the spiral from that point. As was the case earlier, the larger blue spiral will reach an earlier, faster apex and the smaller red one will reach a later, slower one. Also just as with the circles, differing spiral sizes create a steady progression of apexes so if a driver needs to shift their apex earlier to optimize their exit, they should make their corner entry spiral larger. Likewise, if they need a later apex they will make their corner entry spiral smaller.

Final Words
As in the first lesson, the principles learned here are not meant to be used by a driver to try to precisely calculate the ideal line. There are a great many car and track variables that will influence the precise maximum force available at any moment and these will all affect exactly how quickly the driver should be moving around the edge of the G-G plot at any given instant. While a quality lap simulator can provide a reasonably accurate solution, this is primarily useful for race teams to develop setups and strategy, as they often have limited track time. Telemetry data from a fast driver can often be closer to an ideal lap, but even if the telemetry for a perfect lap were available, this would only best be used as a general guideline.
As in the first lesson, the principles learned here are not meant to be used by a driver to try to precisely calculate the ideal line. There are a great many car and track variables that will influence the precise maximum force available at any moment and these will all affect exactly how quickly the driver should be moving around the edge of the G-G plot at any given instant. While a quality lap simulator can provide a reasonably accurate solution, this is primarily useful for race teams to develop setups and strategy, as they often have limited track time. Telemetry data from a fast driver can often be closer to an ideal lap, but even if the telemetry for a perfect lap were available, this would only best be used as a general guideline.
While with enough effort, a reasonably quick performance can be achieved by attempting to copy a fast lap, a driver can never reach the top levels with this method. The fastest drivers can’t be achieving those results by copying someone faster. They are focused on something else, and we can use the physics that govern the ideal line to understand what that is. We’ve learned that maximizing the vehicle’s movement in the ideal directions is what reduces lap times, and a driver can use this principle to guide them. Rather than focus on trying to copy the lines and inputs that are the results of this optimized vehicle movement, a driver can instead focus on the actual movement itself. I started calling this the Universal Cue because properly focusing on optimizing a car’s overall movement on track can guide all a driver’s inputs and allow them to quickly adapt to different cars, tracks, and conditions. Developing this is a primary goal of the Academy program and one of the first exercises uses the dragstrip visualization technique we talked about in this lesson in order to begin training this ability.
| I hope you enjoyed this second installment in the Racing line Fundamentals series and if you have any questions, please use the comments section below. Up next, we’ll look at the first of the two linked apex corner types, the chicane. If you are interested in a complete guide to the physics of racing, we also offer The Science of Speed book series, available through our bookstore or at popular retailers such as Amazon. Adam Brouillard |  1. The Acceleration Point 2. The Ideal Apex 3. The Chicane 4. The Double Apex 5. The Straightaway 6. The 90-Degree Limit |